

If you’re like me, when you see an article that says that you “must know” something, your immediate response is, “Why do I need to know it?”
I mean, I’m pretty sure something like SaaS metrics isn’t going to show up during Tuesday night’s trivia contest.
I would be very surprised (but also very happy).
The more research I do in my writing, the more I find that there are a ton of marketing topics that get the “must know” treatment. Kind of like keyword research — there’s a lot to remember and not much application.
So forget “must know.” How about some applied knowledge for a change?
For a brief, shining moment, I want to give you a breakdown of the most important SaaS marketing metrics and how to use them to grow your SaaS marketing efforts.
I’m not only going to introduce the SaaS marketing funnel and metrics you’ll need, but I’ll also share the context that you’ll need to use them in. You’ll see why they’re important and how to use them to inform decisions.
Let’s get started.

Get long-term ROI.
We help you grow through expertise, strategy, and the best content on the web.
Why are SaaS Marketing Metrics Different?
First off, you have to understand that SaaS marketing really is different than normal digital marketing.
Really, it’s just because some people are gluttons for punishment. (I’m looking at you, SaaS company peeps.)
To illustrate why I say that, here’s an image that you’ve probably seen a million times (or at least seen a million versions of):

This is the customer engagement funnel, which is a euphemism for “sales funnel” or the “customers journey.”
Call it whatever you want, but go look at it again. Most funnels stop at the middle after you close the first sale, right?
So why is there an inverted funnel at the bottom of this one?
I like to call that the party hat, because that’s where SaaS businesses really make money.
Again, because the SaaS marketing funnel is different, customer acquisition is only half the story. There’s a lot more to do if you want to see any serious SaaS growth.
The challenge of SaaS sales and marketing for a Saas business is that it never ends. Thus, they’re gluttons for punishment.
Here’s what I mean:
When a new customer signs up on a monthly subscription for a SaaS product, you have to make sure that their credit card is still billable at the end of each cycle.
If they drop out, unsubscribe, or their card expires (guilty), then you don’t get any revenue. The first payment is just a drop in the bucket compared to the monthly recurring revenue you’re aiming for.

So the traditional marketing analytics and metrics fail to capture key elements that drive SaaS marketing ROI. The normal way of looking at marketing metrics would bankrupt you in about three months.
The result is that SaaS marketers have three jobs instead of one.
Lucky them.
Your normal marketer just has to acquire a customer. The SaaS marketing team has to retain them and then monetize them as well.
Just look at a successful SaaS service like Visual Website Optimizer. To get you started (once they attract you to their site), they offer a free 30-day trial.
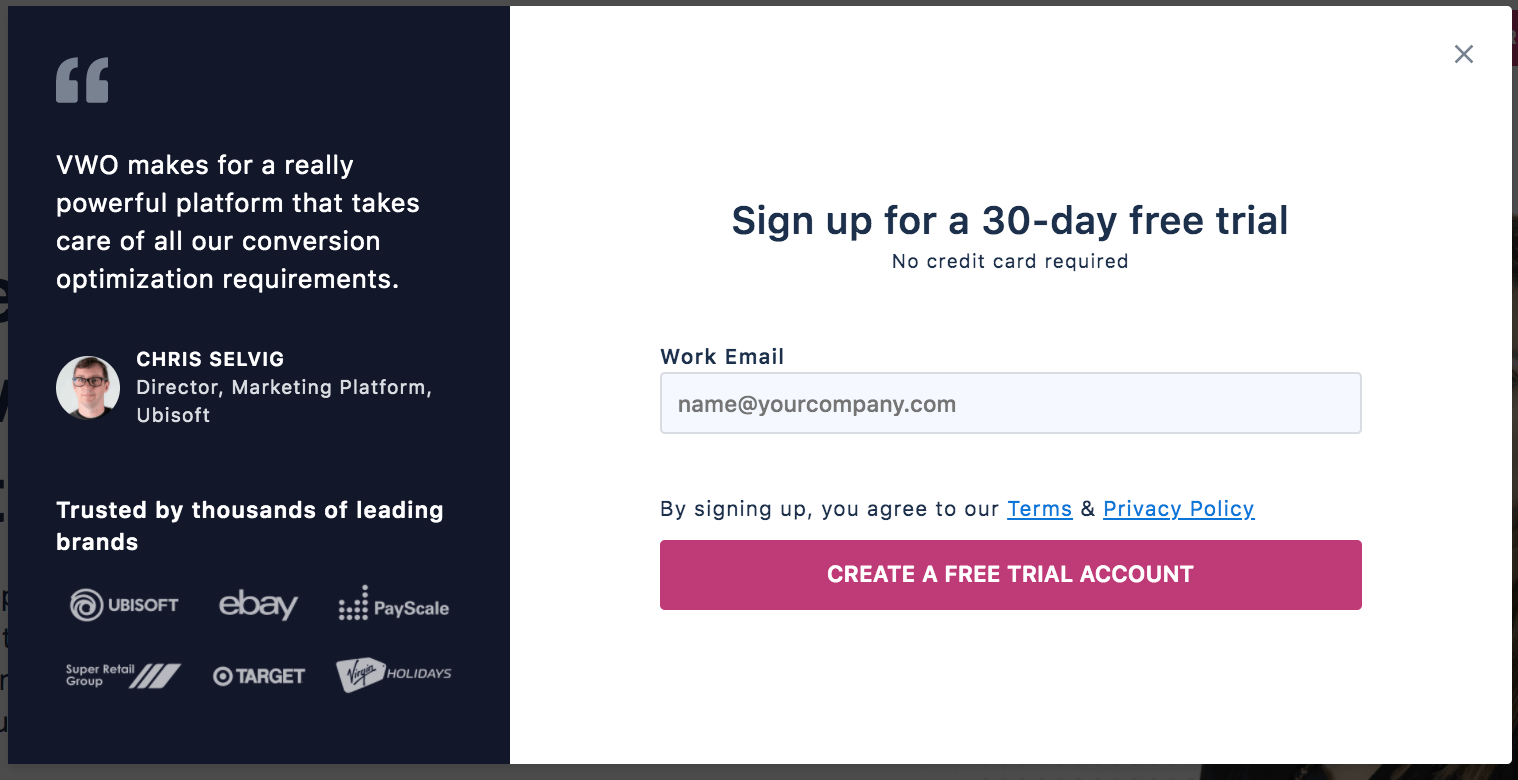
Offering a free trial is part of their marketing strategy to get you through the door, but it’s not making them very much money (at least not initially).
It definitely costs them money, but they’re hoping that you’ll like the service enough to upgrade your free trial to a paid plan.
Because that’s where real revenue growth comes in — from existing customers who stay month after month.
That’s customer retention.
And once you buy, you’ll probably start at the lowest plan for their SaaS product. But they anticipate that your business will grow, and then you’ll need and pay for an upgraded plan.
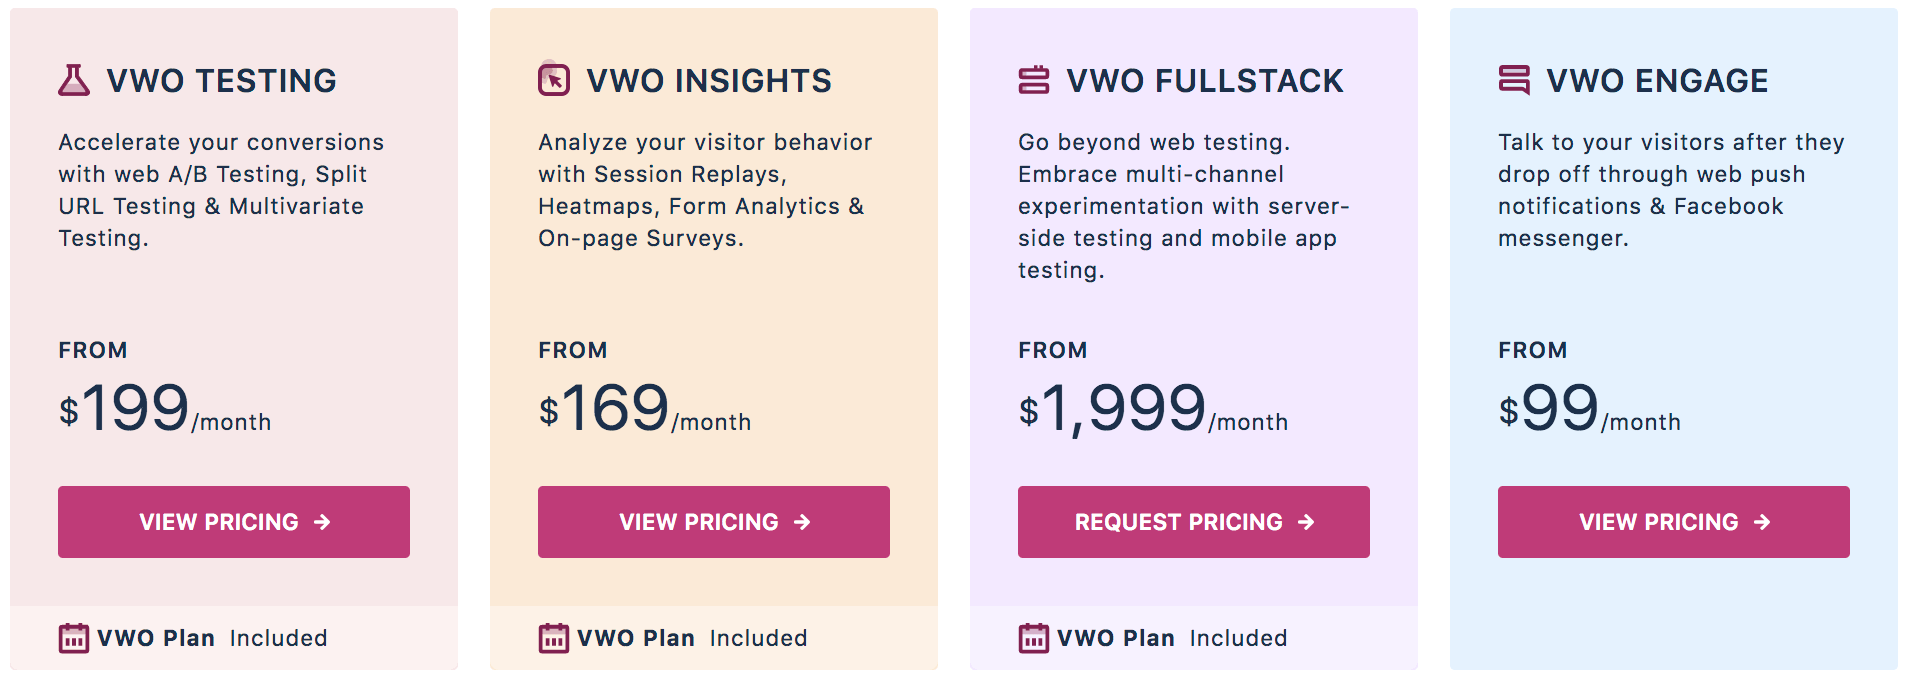
That’s a pretty standard SaaS sales funnel — free stuff, then not-free stuff, and then expensive stuff later.
But what does that actually do for SaaS marketers? It leaves them in an ROI hole when they win a new customer. Most SaaS business models take months or even years to recoup their customer acquisition cost.
Here’s a look at the cumulative cash flow for a customer:
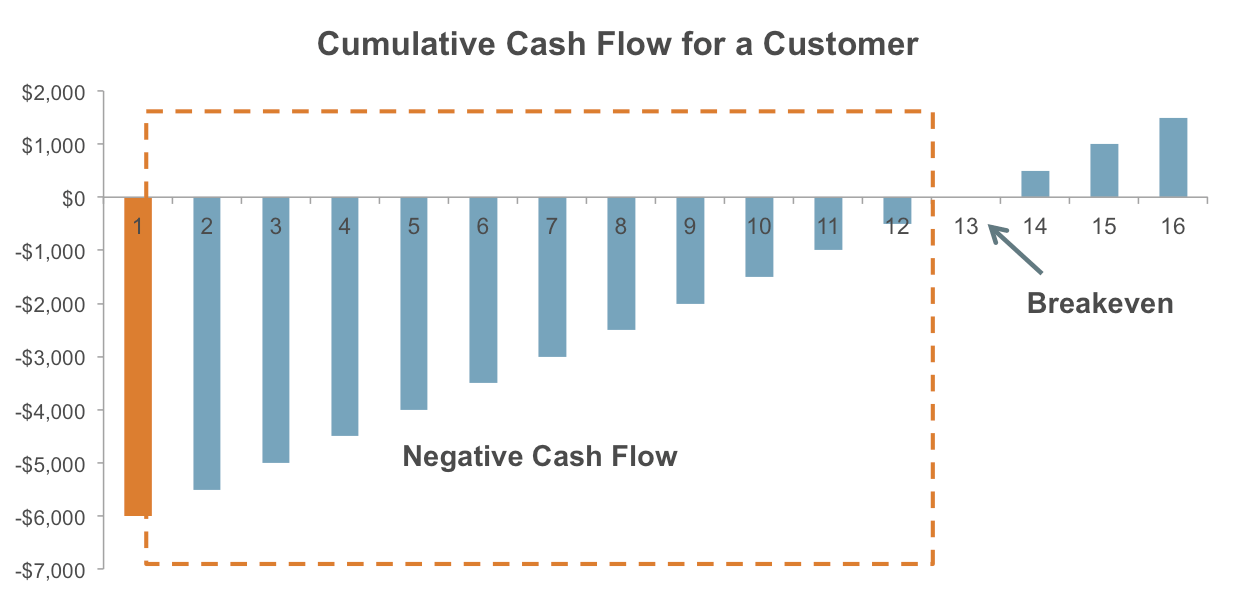
If it weren’t a brilliant business model, you’d look at a graph like that and think that all SaaS company owners were dumb. (They’re not, but talk about risk!)
So SaaS marketers are not only on the hook for longer than others, but they’re also fighting against negative cash flows for months on end. I don’t have to tell you what happens if they don’t make up that cash flow or have enough funding.
And then, to make matters worse, there’s the ever-present temptation to just measure everything. This leads to anchoring, which leads to bad decision making.
And bad decision making puts you squarely in the startup graveyard.

So the domino effect is real here. One marketer doing a bad job means that everyone loses their jobs in the end.
Thankfully, you have guides like this to help you do your SaaS marketing correctly. In this case, your success hinges on some need-to-know SaaS metrics and blog KPIs, and how you approach them.
Once you understand these metrics, you’ll be able to grow your SaaS business to new heights and generate more recurring revenue.
For the rest of this post, I’m going to break down the metrics you need to acquire, retain, and monetize your existing customers like a pro.
7 SaaS Marketing Metrics You Can’t Afford to Ignore
But first, a word on the importance of reading things and acting accordingly.
When I was 18, I ignored a stop sign and was lucky enough to have a courteous cop pull me over. It’s almost like he knew that people did that all the time at that one abandoned railroad track. But I digress.
I got off with community service hours — lucky me. But it could’ve been much worse. I could’ve intimately introduced myself to a train engine.
So I don’t do that kind of thing anymore.
But these SaaS marketing metrics? They’re that metaphorical stop sign, and you’re 18-year-old me.
I was dumb to ignore that sign. I could’ve seriously injured someone. Or even died.
And you’d be dumb to ignore these metrics. If you do, your business will go under.
So, first things first. Let’s point out some metrics that will help you reel in some customers.
These metrics will help you assess the overall health of your inbound marketing and let you see if your SaaS marketing funnel is actually working.
#1: Visitors, marketing leads, and sales leads
It’s simple math:
If your site isn’t getting any visitors, you won’t be getting any marketing conversions. No conversions, no customers.
No customers, no business.
This is all basic, top-of-the-funnel stuff, which means that it usually gets thrown into one big bucket for you to digest because “you already know it.”
That may be so, but I want to break all of that down to its basics and show you why this is still important for you to track. This might seem simple, but try telling LeBron James that the fundamentals aren’t important!
So, first things first: Where do you go to measure traffic and start this chain of basic metric glory?
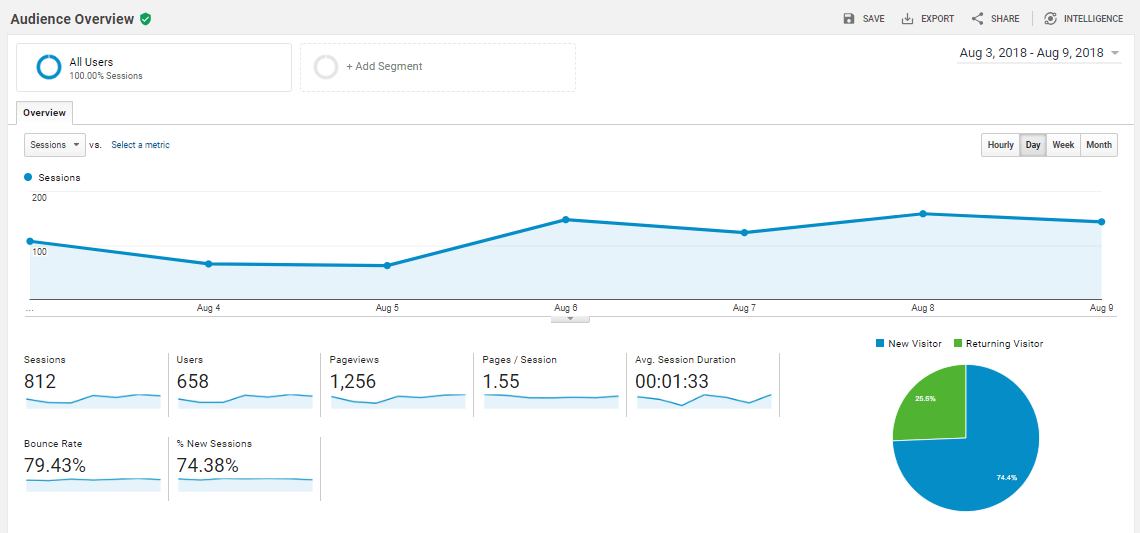
My recommendation for measuring traffic would be to use Google Analytics. It’s free, simple, and accurate. Just go to Audience > Overview and then set your desired date range to get your unique visitor stats.
But what traffic stats do you need to aim for? That depends.
The current median traffic for a SaaS site is about 45,000 visitors per month from content marketing. The top 10% see upwards of 100,000 and the lower end sees less than 10.

So, how much traffic should you aim for?
The honest answer is that you need to get “enough” traffic for your business. Depending on what you’re selling and how you’ve priced your SaaS product, more or less traffic can be good or bad.
It’s a vague answer, I know.
But unique visitors can be a vanity metric though. High traffic is no guarantee that you’ll get customer conversions. There are just too many factors to take into consideration.
So you need to have a balance between your traffic, good content, and a compelling CTA to turn those leads into customers.
And speaking of leads:
Remember that funnel from earlier?
Well, here’s another one:

What’s different this time?
Trick question. It’s the same funnel, but with different labels. Marketers and their shapes, right?
Only this time, we’re only looking at the top, and we’re talking about how you can categorize and track leads in your funnel.
Marketing Qualified Leads (MQLs) and Sales Qualified Leads (SQLs) are top-funnel SaaS marketing metrics — they indicate how likely a prospect is to become a customer. They’re simply a shorthand for different stages, but tracking them is still important.
Let’s go back to the Visual Website Optimizer example we looked at earlier. An MQL would likely be a business that is looking to optimize their conversion rates.
So to kick things off, your first goal is to get your visitors to become marketing qualified leads. MQLs are individuals who, based on their behavior, look like they might be interested in buying.

On the other hand, SQLs are those who have moved past viewing a marketing campaign and are ready to buy. Even though they may not complete a purchase, tracking SQLs can give you a better idea of where your bottom line stands.
To track these two SaaS metrics, you will need to either be a very diligent notetaker or invest in a good CRM. You’ll also need a good lead magnet to keep your prospects moving through the marketing funnel.
For example, you could offer a downloadable piece of content on your site like a report or an eBook. Then you can slowly nurture those leads until they convert.
Tracking each marketing qualified lead you receive through your website or other marketing channel is vital. Yet again, it’s another basic element of SaaS marketing.
This affects your conversion rates and ultimately helps you determine how much traffic you need in order to attain the right amount of customers.
Consider an example of a leading MDM solution, Scalefusion that offers device and endpoint management, including kiosk software. To build their prospect list, they offer you a free demonstration of their product. This is a part of their marketing strategy, and it acts as a great lead magnet since their potential customers get a chance to know how their product works and if it fits within their business requirements.

Let’s look at an example:
Say you get 1,000 unique website visitors per month. Of those 1,000 visitors, 100 indicate that they are MQLs. That’s a conversion rate of 10%.
From there, 10 of those become SQLs. Again, another conversion rate of 10%.
Let’s say that an average of 5 of those 10 SQLs start using your product. That’s a 50% close rate of SQLs, but an overall 0.5% visitor-to-customer conversion rate.
You gotta pump those rookie numbers up.
But now you know what to look for. And you can start using these numbers and the corresponding conversion rates to go back and inform how many unique visitors you need in order to stay afloat.
And once you’ve taken care of the top of the funnel, it’s time to turn your attention to the bottom. Let’s look at that now.
#2: Customer churn
Customer churn is, metaphorically speaking, the divorce rate of SaaS marketing metrics.
It seeks to tell you how many of those hard-won existing customers decided that they would rather keep their money in their own bank accounts.
If that’s not bad enough for you, here’s a rather macabre image involving fish that will help you understand customer churn rate even better:

That poor little goldfish.
All jokes aside, this is a great representation of how your SaaS product is going to work.
Some of your “fish” (customers) will happily stay at the basic levels of your product. Some will jump to the exclusive fishbowl that costs extra.
And some will jump out of the tank altogether.
The nice thing is that you can track and eventually predict how many of these customers will jump ship. This helps you go back to the top of your funnel and make even more adjustments like boosting your content marketing efforts to generate more leads.
But it also helps you see how effective your product’s onboarding is. If your customer churn rate is high, you probably didn’t quite nail the user experience of your product. That means that lowering customer churn needs to be a priority.
Or else all the “fish” in your tank will jump elsewhere.
Once again, a good churn rate is relative. Average customer churn rates are around 5.60%, but that doesn’t make a higher or lower number good or bad. B2B and B2C will be different, and even then, it’s hard to definitively say without putting it next to your bottom line.

For example, in Groove’s case, they were sitting at a 4.5% churn rate. That’s well under the average churn rate above, but they knew from their own data that it wasn’t sustainable for their business.
They needed to lower it, or they’d lose the farm.
They found that if they could keep a user engaged for a little more than three minutes during their first session, the user was far more likely to keep using their SaaS software.

So they rolled up their sleeves and improved their onboarding. Farm saved!
But customer churn is only one part of the equation here.
In addition to customer churn, you also need to assess how this affects your bottom line. That’s called revenue churn, and it’s where all of this starts to get trickier.
You know that marketers love to make things more complicated than they need to be, so I’ll help you out.
#3: Revenue churn
Revenue churn, also called Monthly Recurring Revenue or MRR churn rate, is pretty easy at first if you understand customer churn. It’s just the dollar amount that you can assign to the customers you lose.
In other words, this is what you pay in alimony and lawyer fees once the divorce is finalized.
Let’s look at a basic example.
Let’s say that you have a 5% churn rate one month. During that month, you also closed the deal with 100 customers. So, you lost 5 customers almost as soon as you got them.
Those five customers would have paid $10 for their subscription, but now they won’t. That means that your revenue churn is $50.
The average churn rate sits at about 7.5%. One factor that affects revenue churn is pricing — SaaS companies that charge under $10 have lower churn rates than companies that charge over $250.

But why does this matter? You still make money off of the other 95 customers, right?
It matters because, over time, those churned customers would have been worth much more money than one small monthly subscription fee. If customers are leaving faster than you can acquire them, your SaaS company is in serious trouble.
That means that your customer retention metrics are pointing customers further down the funnel toward your monetization metrics.
We’ll tackle those next.
#4: Net dollar retention and negative churn
Net dollar retention is the ultimate application of customer and revenue churn. This key SaaS metric seeks to display the overall health of a company’s retention tactics.
In terms of our ongoing divorce analogy, you can think of this like getting back into the dating pool — while still married.
Maybe this is getting too edgy now, so I’ll drop the analogy.
But let’s get back to the business end. The idea is that by expanding on the worth of a retained cohort of customers, those customers will be worth more than new ones.
In other words, selling more to the existing customers you already have should be an easier path to profits for you.
This goes back to that graph that we looked at earlier that went from negative to positive ROI over time.
The goal of net dollar retention is often expressed as net negative churn. This is the ability to prove that the revenue from your retained customers is, in fact, making up for customer and revenue churn.
In order to find out what your net negative churn is, you need to know two things:
- How much revenue churn you’ve had
- How much expansion (upsell or cross-sell) revenue you’ve had in the same time period
To find out if you’re growing the worth of previous customers, you need to take your lost revenue percentage and subtract the expansion percentage. If the number is negative, your churn has a net negative, which means that you’re still growing your revenue.

With a net negative churn, your customers slowly increase their worth to your business and grow your bottom line over time.
To illustrate the long-term effects of failing to achieve net negative churn, here’s a look at a graph that shows the potential earnings of different churn rates over a period of time:

As you can see, a net negative churn of even -2.5% can make a serious impact on your revenue streams. Retaining customers and selling more to them is highly profitable.
Just look at HubSpot: Their net retention dollar was 90% when their IPO launched and now it’s over 100%. The company is constantly releasing new products, which leads to their existing customers spending more.
Another example comes from the eCommerce platform Shopify.
Shopify allows business owners to set up a store even if they have no previous experience. Each year, Shopify has continued building their revenue on top of the previous year’s cohort despite churn.

That’s the power of net negative churn. It takes $100 worth of customers and turns them into $150 worth.
Which, coincidentally, leads us to the next monetization metric you should consider.
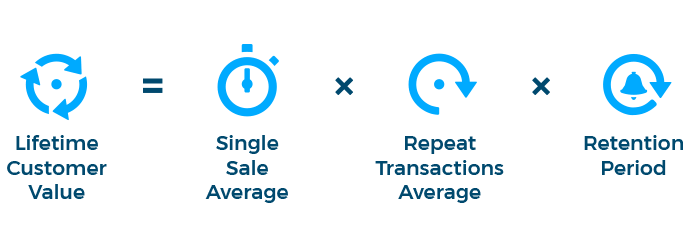
#5: Customer lifetime value (CLV)
Customer lifetime value (often abbreviated CLV or LTV) is one of those quintessential SaaS metrics that every marketer needs to consider but no one seems to agree on.
Seriously, there must be at least a million different equations for CLV on Google.
But since SaaS products are built to generate monthly recurring revenue, this is the literal backbone metric of your whole operation.

Simply put, this SaaS metric shows you how much money you’re likely to make from a single customer over the course of their relationship with you. A one-time buyer is only worth the amount they spend once, whereas a subscriber generates recurring revenue for your business.
CLV is usually calculated with a series of projected metrics, sort of like this:
A great example of how this helps you comes from a study done by Nielsen and Kimberly-Clark.
In the study, they found that the average shopper would buy $1,000 worth of diapers over the course of their child’s infancy. That means that Kimberly-Clark knows exactly how many customers they need to hit certain sales targets.
Since they can’t do anything about the declining birth rates, their only way to increase their sales is finding new ways to either win customers or improve their lifetime value.
And for companies that aren’t able to do this type of extensive research, Google Analytics is now giving you the next best thing. Their Lifetime Value report shows you the value of different users.
The report also shows you the customer lifetime value of each marketing channel. Why is this useful? Because it means you can invest more on those channels that lead to your most profitable customers.
So, maybe just ignore all of those equations unless you know something I don’t.
Just go to Audience > Lifetime Value and find the chart that looks like this:

This information lets you compare customer lifetime value from your various marketing campaigns and channels. It shows potential weaknesses in your acquisition and customer retention strategies, but more importantly, it shows you where you can start further monetizing.
And this isn’t just something I pulled out of thin air. Another great case study comes from Snappa, who managed to get more than $33,000 in recurring monthly income in only two years.
How? They quantified CLV and doubled down on it.
And then they balanced it with our next metric: Customer acquisition cost.
#6: Customer acquisition cost (CAC)
Customer acquisition cost (or CAC) is yet another key SaaS metric, and you’ll see why in just a moment.
This metric is pretty self-explanatory. It’s how much it costs your business to win one new customer.
To find it, all you have to do is divide your marketing spend by the number of customers you’ve picked up over a set time period.
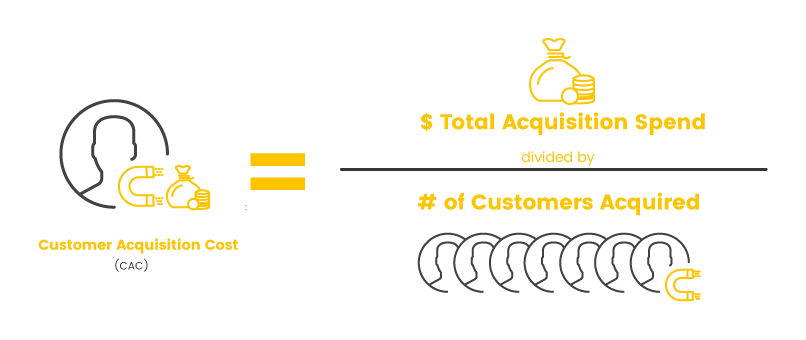
Your end result is that you know how much money it takes to get a new customer. It’s a simple but important calculation because it relates to the CLV:CAC ratio.
#7: CLV:CAC ratio
The ultimate monetization metric isn’t just one metric. It’s two becoming one. (Had to have at least one marriage joke to make up for all the divorce references.)
The customer lifetime value to customer acquisition cost ratio (CLV:CAC) allows you to measure the relationship between how much revenue you’re likely to make and how much it costs you to make that revenue.

And as a subscription-based company that starts in an ROI hole, this SaaS metric is vital.
Just think about what this ratio means in application. If you have a 1:1 ratio here, that means that you spend the same amount of money getting a customer as they’re likely to spend on your business.
Since your business has more expenses than just marketing, a 1:1 ratio means that you’re bleeding money.
But what about a 20:1 ratio? That means that you’re making 20 times the amount it takes to acquire a customer. That’s good, right?
Yes and no. It’s good because you’re making money, but it’s bad because a competitor can come in and undercut you without any serious consequences to their bottom line.
You’ll eventually start losing sales to competitors on price alone, even if your product is better.
That’s why studies have revealed that the ideal ratio is 3:1 for this metric. That’s enough so that you’re making money on each customer while maintaining your bottom line and fostering a high degree of competition.
And this metric is vital because it allows you to circle back and factor in the rest of the metrics we’ve looked at via conversion rate optimization. If you can lower your CAC or raise your CLV in any way, it will impact your bottom line.
Conclusion
So the next time you’re at Tuesday night trivia and get a SaaS metrics question, call me. Because I’m moving to that town.
But until then, start applying your SaaS marketing metrics knowledge in a way that actually helps your business stay afloat.
Don’t just go for one-sided or vanity metrics that show that you’re winning customers. Take your metrics all the way down the funnel and then out the other side.
Your job as a marketer for a SaaS company is to acquire, retain, and monetize. It may not be fair that you have more to do than the rest of us, but the truth is you may actually have it easier.
Using the metrics in this post can allow you to inform every stage of your product’s evolution. That’s not a perk everyone gets.
So start tracking and don’t let up.
Grow your SaaS business with a great content strategy. Get an instant quote now for a price estimate. It’ll only take you a moment.

